Copyright © 2009 Manuel Rego Casasnovas
Some rights reserved. This document is distributed under the Creative Commons Attribution-ShareAlike 3.0 license, available in http://creativecommons.org/licenses/by-sa/3.0/
Table of Contents
Abstract
gedit is the GNOME text editor. The project has been growing since the beginning of GNOME to become a powerful general purpose text editor. This article gives an overview about this project, studying historical data from different sources: packages, repository, mailing lists, ...
This article tries to make an analysis of the gedit project from the historical point of view. The information used to redact this document was gotten from different sources like released versions, source code management, mailing lists, ...; using some tools like SLOCCount, CVSAnalY, Mailing List Stats, ...
gedit is the official text editor of the GNOME desktop environment, it is a small and lightweight UTF-8 general purpose text editor. Its aim is the simplicity and ease of use, however it is a powerful editor.
gedit is part of GNOME from the beginning of the project. It uses the latests libraries from the GNOME stack, including GTK+ as graphical toolkit. Providing a complete integration with the GNOME environment. It is a common example about how to develop a GNOME application and find examples about how to use the different libraries.
The main features of gedit are:
Full support for UTF-8 text.
Syntax highlighting for various program code and text markup formats.
Support for editing remote files.
Common undo/redo and search/replace operations.
Complete preferences system.
Configurable and flexible plugins system, with optional Python support.
The history of gedit is linked to the GNOME project. GNOME was started in 1997 as an alternative desktop to KDE, because of Qt widget toolkit was not free software. As any desktop, GNOME needed a text editor, and gedit was started in April 1998 (first commit at SVN repository).
Nowadays, gedit is more than a simple text editor, it has a lot of features and a powerful plugins system. Making it extensible, flexible and useful for more complex tasks that just edit plain text.
gedit is part of the core of the GNOME project from the beginning, which means that its community is, in some way, the whole GNOME community. The fact of belonging to a such large community, makes possible to take advantage of other efforts and share efforts with other people. For example, version 2.26 is translated into 88 languages and gedit developers do not have to take care about this issue.
As any free software project, gedit has its own mailing list and IRC channel, as well as it uses the GNOME Bugzilla. All these tools help to manage the communication between the users and developers of the project (see more).
gedit is released under the GNU General Public License (GPL) version 2, as most GNOME projects.
There are just some files licensed under GNU Lesser General
Public License version 2, and this is because of these files belongs to
external libraries (libegg and libsexy)
used in gedit. Moreover, libsexy is already deprecated and
it is just used if GTK+ version is less than 2.15.0.
This section is going to analyze different data about the gedit project. You can find more information about the tools used at Appendix A, Tools. Furthermore, all the steps needed to generate the charts are explained at Appendix B, Instructions appendix.
In this section we are going to analyze the information extracted with SLOCCount over different versions of gedit. Summarizing, SLOCCount counts the source lines of code of a program.
The versions used were: 0.5, 0.9, 2.0 and all stable releases from this onwards, that is the versions ended with even numbers.
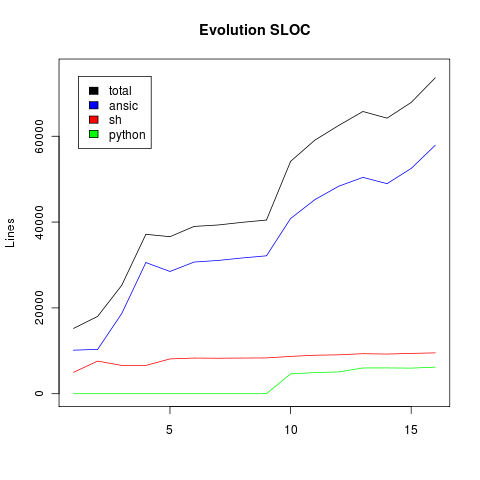
In the Figure 1, “Evolution source lines of code” you can see the evolution of source lines between the different versions. The chart reflects a continuous (more or less) growth since the beginning of the project.
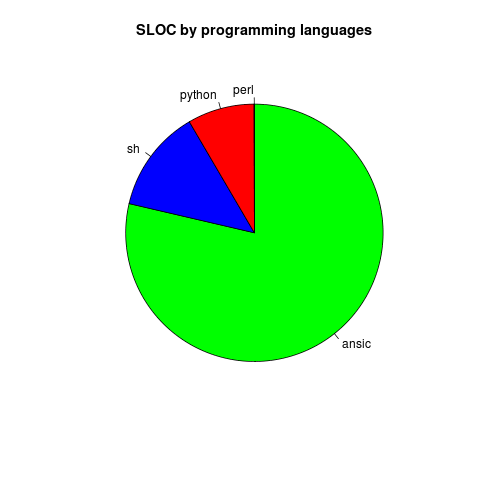
gedit is mainly written in C (78.64% in the last stable version 2.26) as it is clearly showed in the Figure 2, “Source lines of code by programming language ”. Again the main language are the same of the most GNOME projects. Another languages used are: Bash, mainly for configuration and compilation; and Python, in order to support plugins written in that language.
In this section it is shown an analysis based on the data extracted from the SVN repository of the gedit project. This data was extracted with CVSAnalY. As the repository used was the SVN, the last data is from April 2009; because of the GNOME migration to Git happened in that date.
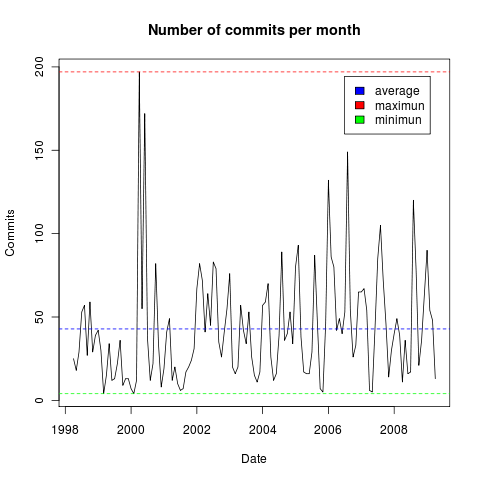
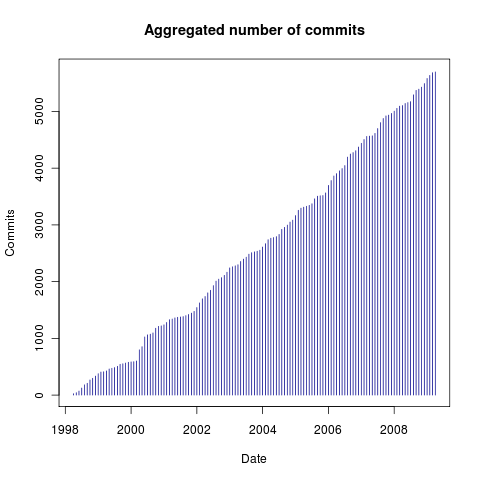
There have been 326 committers throughout the project history, that have made a total of 5697 commits. The number of commits per month activity has a lot of ups and downs with an average of 42.83 (see Figure 3, “Evolution of commits per month”). The maximum were 197 in April 2000, and the minimum is shared between March 1999 and February 2000 with just 4 commits. Anyway, in the logn term the activity is keeping almost constant as it is shown in Figure 4, “Aggregated number of commits up to time”.
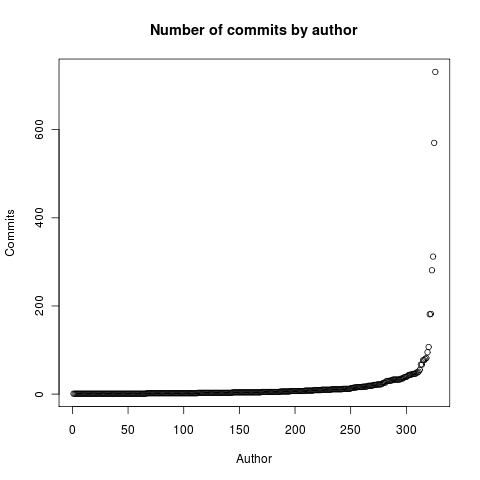
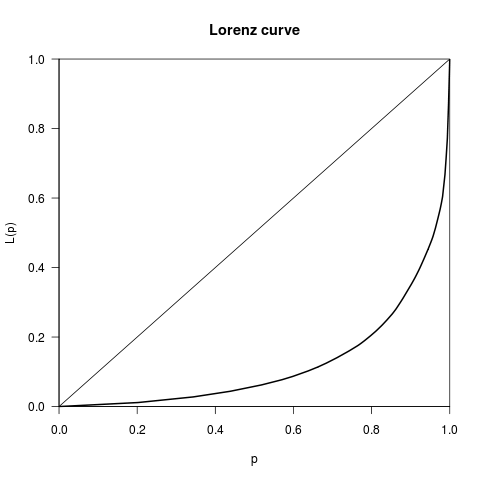
The Figure 5, “Number of commits per author” shows the number of commits per author. Then, in order to study the relation between the committers and the number of commits in depth, it was calculated the Gini coefficient, in this case the value is 0.7546308. As usual in free software projects this value confirms the Pareto principle, which states that, roughly 80% of the commits are done for 20% of the committers, and viceversa. The Lorenz curve (see Figure 6, “Lorenz curve”) shows this relation, where the perfect equity would be the straight line.
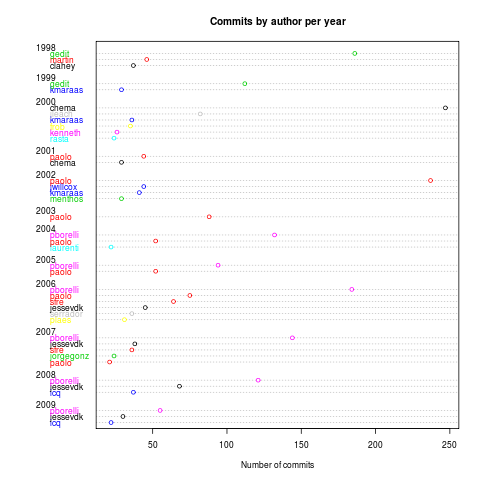
Finally, the next chart (Figure 7, “Number of commits by author per year”)
shows the number of commits made by the most collaborative authors per year.
That means, for every year it shows the commits for authors that made more than
20 commits. Thanks to this chart you can see how different developers appear and
disappear during the project history. Where the main contributors per year have
been: gedit (1998-1999), chema (2000),
paolo (2001-2003) and pborelli
(2004-2009).
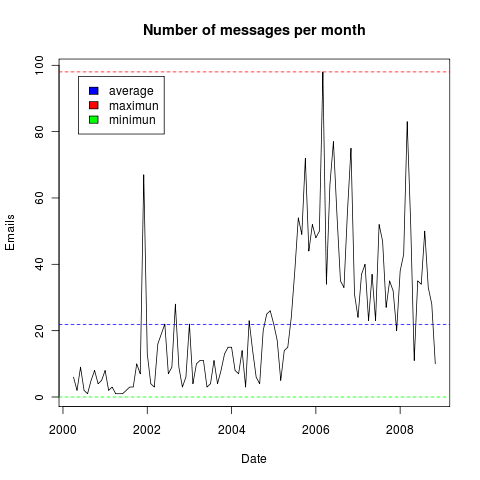
The gedit project has been using a mailing list since April 2000. Mailing List Stats was used to analyze this mailing list.
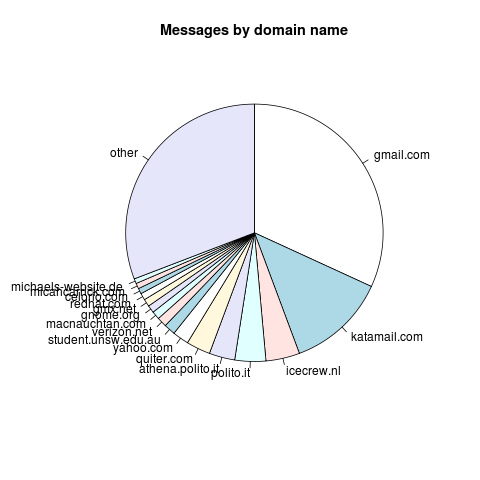
The total number of emails sent to this list is 2446, and these emails were written by 613 different email addresses. The mean of messages per month is 21.84 (see Figure 8, “Evolution of messages per month”).
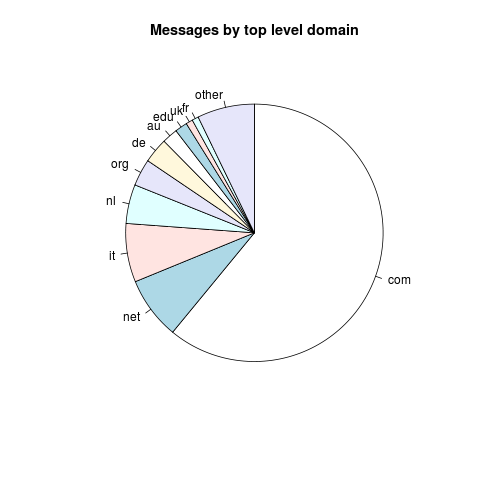
The most common domain name is gmail.com and the top level domain is com. However, the it domain is in the first position (taking into account just country domains), mainly because of two of the main contributors are Italians. The charts Figure 9, “Messages by domain name” and Figure 10, “Messages by top level domain” show the number of messages sent to the mailing list by domain.
gedit is in a continuous evolution since the beginning of the project. Furthermore, it is adding more and more features over time, expanding its scope. The core developers have changed, however the project activity seems to keep almost constant.
To sum up and taking into account the extracted data, we can considerate gedit as a mature and active free software project that is still growing.
A. Tools
This appendix just add some basic description about the different different tools that were used to redact this report.
- SLOCCount
SLOCCount is a set of tools for counting source lines of code of a program. It counts the number of lines for every language in every folder. Moreover, it calculates the estimated cost based on COCOMO model.
- CVSAnalY
CVSAnalY is a program to extract information from the source code management system of a project. The information extracted is stored into a relational database in order to make easier query this information.
- Mailing List Stats
Mailing List Stats is a tool that analyse a mailing list and stores all the information extraced in a database.
- R project
R is a GNU project that provides a free software environment for statistical computing and graphics. It is similiar to the S language and it is highly extensible.
B. Instructions appendix
In this appendix you can find the steps needed to get the data and create the graphics showed in this article.
After run SLOCCount over the different versions of gedit, the information gathered was inserted in a database table with the next structrue:
CREATE TABLE gedit (
	version VARCHAR(5),
	date DATE,
	size INT(11),
	`lines` INT(11),
	ansic INT(11),
	sh INT(11),
	sed INT(11),
	python INT(11),
	perl INT(11),

	PRIMARY KEY(version)
);
The data was inserted with different sentences like that:
INSERT INTO gedit VALUES ("0.5", "1999-02-12", 364591,
                          15210, 10142, 4975, 93, 0,  0);
R commands:
library(RMySQL)

con <- dbConnect(dbDriver("MySQL"), user="root",
                 password="root", dbname="gedit_sloccount")

query <- "SELECT * FROM gedit;"
results <- dbGetQuery(con,query)
plot(results$lines, type="l", ylim=c(0,75e3),
     xlab="", ylab="Lines", main="Evolution SLOC")
lines(results$ansic, col="blue", type="l")
lines(results$sh, col="red", type="l")
lines(results$python, col="green", type="l")
legend("topleft", inset=.05, c("total", "ansic", "sh", "python"),
       fill=c("black", "blue", "red", "green"))
R commands:
pie(main="SLOC by programming languages", c(57909, 9515, 6180, 30),
    col=c("green", "blue", "red", "yellow"), clockwise=1,
    labels=c("ansic", "sh", "python", "perl"))
See Figure 2, “Source lines of code by programming language ”.
In order to extract the data the command executed was:
cvsanaly2 -u root -p root -d gedit_cvsanaly --extensions=Metrics --metrics-all http://svn.gnome.org/svn/gedit/trunk/
R commands:
library(RMySQL)

con <- dbConnect(dbDriver("MySQL"), user="root",
                 password="root", dbname="gedit_cvsanaly")

query <- "SELECT date_format(s.date, '%m/%Y') date, count(s.id) commits
          FROM scmlog s group by date_format(s.date,'%Y%m');"
results <- dbGetQuery(con,query)

evol_commits <- ts(results$commits, start=c(1998,4), freq=12)
plot(evol_commits, type="l", xlab="Date", ylab="Commits",
     main="Number of commits per month")

query_avg <- "SELECT AVG(g.numcommits)
	FROM
	( SELECT date_format(s.date, '%Y') myyear,
		date_format(s.date, '%m') mymonth, count(s.id) numcommits
		FROM scmlog s
		GROUP BY date_format(s.date,'%Y%m') ) g;"
result_avg <- dbGetQuery(con,query_avg)
qqline(result_avg, col="blue", lty=2)

query_max_min <- "SELECT MAX(g.numcommits) as max, MIN(g.numcommits) as min
	FROM
	( SELECT date_format(s.date, '%Y') myyear,
		date_format(s.date, '%m') mymonth,
		count(s.id) numcommits
		FROM scmlog s
		GROUP BY date_format(s.date,'%Y%m') ) g;"
result_max_min <- dbGetQuery(con,query_max_min)
qqline(result_max_min$max, col="red", lty=2)
qqline(result_max_min$min, col="green", lty=2)

legend("topright", inset=.05, c("average","maximun","minimun"),
       fill=c("blue","red","green"))
R commands:
query <- "SELECT g.myyear, g.mymonth, g.numcommits,
		(@sumacu:=@sumacu+g.numcommits) aggregated_numcommits
	FROM
		(SELECT @sumacu:=0) r, (SELECT date_format(s.date, '%Y') myyear,
			date_format(s.date, '%m') mymonth,
			COUNT(s.id) numcommits
		FROM scmlog s
		GROUP BY date_format(s.date,'%Y%m')) g;"
results <- dbGetQuery(con,query)
evol_num_commits <- ts(results$aggregated_numcommits, start=c(1998,4), freq=12)
plot(evol_num_commits, type="h", xlab="Date", ylab="Commits",
     main="Aggregated number of commits", col = "dark blue")
R commands:
query <- "SELECT p.name author, count(s.id) commits
	FROM scmlog s LEFT JOIN people p ON s.committer_id=p.id
	GROUP BY committer_id ORDER BY commits;"
results <- dbGetQuery(con,query)
plot(results$commits, xlab="Author", ylab="Commits",
     main="Number of commits by author")
R commands:
query <- "SELECT committer_id, count(*) AS num_commits FROM scmlog
          GROUP BY committer_id ORDER BY num_commits desc;"
total_committers <- dbGetQuery(con, query)
library(ineq)

Gini(total_committers$num_commits)

Lc(total_committers$num_commits, plot=T)
R commands:
library(RMySQL)

con <- dbConnect(dbDriver("MySQL"), user="root",
                 password="root", dbname="gedit_cvsanaly")

query <- "
SELECT year, name, num
FROM
(SELECT date_format(s.date, '%Y') AS year, p.name AS name, count(s.id) AS num
FROM scmlog s LEFT JOIN people p ON s.committer_id=p.id
GROUP BY year, name
ORDER BY year, num) g
WHERE g.num > 20;
"

results <- dbGetQuery(con,query)

results$year <- factor(results$year)

query_names <- "
SELECT DISTINCT(name)
FROM
(SELECT date_format(s.date, '%Y') AS year, p.name AS name, count(s.id) AS num
FROM scmlog s LEFT JOIN people p ON s.committer_id=p.id
GROUP BY year, name
ORDER BY year, num) g
WHERE g.num > 20;
"

names <- dbGetQuery(con,query_names)

col <- 1
for (i in names$name) {
	results$color[results$name==i] <- col
	col <- col + 1
}

dotchart(results$num, groups=results$year, labels=results$name,
         color=results$color, cex=.7, xlab="Number of commits",
         main="Commits by author per year")
The command executed to get the information from the gedit mailing list was:
mlstats --db-user root --db-password root --db-name gedit_mlstats --db-admin-user root --db-admin-password root http://mail.gnome.org/archives/gedit-list/
R commands:
library(RMySQL)

con <- dbConnect(dbDriver("MySQL"), user="root",
                 password="root", dbname="gedit_mlstats")

query <- "
SELECT x.myyear,x.mymonth, if(g.key2 is NULL,0,g.messages) Value
FROM fm3_wildcard_date.tblyearmonth x
LEFT JOIN (SELECT date_format(m.first_date, '%Y%m') key2,
COUNT(m.message_ID) messages
FROM messages m
GROUP BY date_format(m.first_date,'%Y%m')) g
ON x.id=g.key2
WHERE x.id>= (SELECT date_format(min(s.first_date), '%Y%m') FROM messages s)
AND x.id<= (SELECT date_format(max(s.first_date), '%Y%m') FROM messages s) ;
"
results <- dbGetQuery(con, query)
evol_messages = ts(results$messages, start=c(2000,4), freq=12)
plot(evol_messages, type="l", xlab="Date", ylab="Emails",
     main="Number of messages per month")

query_avg <- "
SELECT AVG(h.Value)
FROM (
SELECT x.myyear, x.mymonth, if(g.key2 is NULL,0,g.messages) Value
FROM fm3_wildcard_date.tblyearmonth x
LEFT JOIN (SELECT date_format(m.first_date, '%Y%m') key2,
COUNT(m.message_ID) messages
FROM messages m
GROUP BY date_format(m.first_date,'%Y%m')) g
ON x.id=g.key2
WHERE x.id>= (SELECT date_format(min(s.first_date), '%Y%m') FROM messages s)
AND x.id<= (SELECT date_format(max(s.first_date), '%Y%m') FROM messages s)
) h;
"
result_avg <- dbGetQuery(con,query_avg)
qqline(result_avg, col="blue", lty=2)

query_max_min <- "
SELECT MAX(h.Value) max, MIN(h.Value) min
FROM (
SELECT x.myyear, x.mymonth, if(g.key2 is NULL,0,g.messages) Value
FROM fm3_wildcard_date.tblyearmonth x
LEFT JOIN (SELECT date_format(m.first_date, '%Y%m') key2,
COUNT(m.message_ID) messages
FROM messages m
GROUP BY date_format(m.first_date,'%Y%m')) g
ON x.id=g.key2
WHERE x.id>= (SELECT date_format(min(s.first_date), '%Y%m') FROM messages s)
AND x.id<= (SELECT date_format(max(s.first_date), '%Y%m') FROM messages s)
) h;
"
result_max_min <- dbGetQuery(con,query_max_min)
qqline(result_max_min$max, col="red", lty=2)
qqline(result_max_min$min, col="green", lty=2)

legend("topleft", inset=.05, c("average","maximun","minimun"),
       fill=c("blue","red","green"))
R commands:
query <-
"
SELECT *
FROM (
	SELECT COUNT(message_id) num, domain_name
	FROM messages LEFT JOIN people ON author_email_address=email_address
	GROUP BY domain_name ORDER BY num DESC
) g WHERE g.num>=15;
"
results <- dbGetQuery(con,query)

query <-
"
SELECT SUM(g.num) AS sum
FROM (
	SELECT COUNT(message_id) num, domain_name
	FROM messages LEFT JOIN people ON author_email_address=email_address
	GROUP BY domain_name ORDER BY num DESC
) g WHERE g.num<15
"
total_other <- dbGetQuery(con,query)
results <- rbind(results, data.frame(num=total_other$sum, domain_name="other"))

pie(main="Messages by domain name", clockwise=1, results$num,
    labels=results$domain_name)
R commands:
query <-
"
SELECT *
FROM (
	SELECT COUNT(message_id) num, top_level_domain
	FROM messages LEFT JOIN people ON author_email_address=email_address
	GROUP BY top_level_domain ORDER BY num DESC
) g WHERE g.num>=20;
"
results <- dbGetQuery(con,query)

query <-
"
SELECT SUM(g.num) AS sum
FROM (
	SELECT COUNT(message_id) num, top_level_domain
	FROM messages LEFT JOIN people ON author_email_address=email_address
	GROUP BY top_level_domain ORDER BY num DESC
) g WHERE g.num<20
"
total_other <- dbGetQuery(con,query)
results <- rbind(results, data.frame(num=total_other$sum,
                 top_level_domain="other"))

pie(main="Messages by top level domain", clockwise=1, results$num,
    labels=results$top_level_domain)
Gedit - GNOME Live!. The GNOME Project. URL: http://live.gnome.org/Gedit. Last access: 31 Jul 2009.
gedit. The GNOME Project. URL: http://projects.gnome.org/gedit/. Last access: 31 Jul 2009.
GNOME: The Free Software Desktop Project. The GNOME Project. URL: http://www.gnome.org/. Last access: 31 Jul 2009.
GTK+ - About. The GTK+ Team. URL: http://www.gtk.org/. Last access: 31 Jul 2009.
GNU General Public License v2.0 - GNU Project - Free Software Foundation (FSF). Free Software Foundation, Inc.. URL: http://www.gnu.org/licenses/gpl-2.0.html. Last access: 31 Jul 2009.
GNU Lesser General Public License v2.1 - GNU Project - Free Software Foundation (FSF). Free Software Foundation, Inc.. URL: http://www.gnu.org/licenses/old-licenses/lgpl-2.1.html. Last access: 31 Jul 2009.
Gini coefficient - Wikipedia, the free encyclopedia. Wikimedia Foundation, Inc.. URL: http://en.wikipedia.org/wiki/Gini_coefficient. Last access: 31 Jul 2009.
Pareto principle - Wikipedia, the free encyclopedia. Wikimedia Foundation, Inc.. URL: http://en.wikipedia.org/wiki/Pareto_principle. Last access: 31 Jul 2009.
Lorenz curve - Wikipedia, the free encyclopedia. Wikimedia Foundation, Inc.. URL: http://en.wikipedia.org/wiki/Lorenz_curve. Last access: 31 Jul 2009.
SLOCCount. David A. Wheeler. URL: http://www.dwheeler.com/sloccount/. Last access: 31 Jul 2009.
COCOMO - Wikipedia, the free encyclopedia. Wikimedia Foundation, Inc.. URL: http://en.wikipedia.org/wiki/Cocomo. Last access: 31 Jul 2009.
cvsanaly [GSyC/LibreSoft t00ls ]. LibreSoft. URL: http://tools.libresoft.es/cvsanaly. Last access: 31 Jul 2009.
mailing_list_stats [GSyC/LibreSoft t00ls ]. LibreSoft. URL: http://tools.libresoft.es/mailing_list_stats. Last access: 31 Jul 2009.
The R Project for Statistical Computing. Department of Statistics and Mathematics of the WU Wien. URL: http://www.r-project.org/. Last access: 31 Jul 2009.
S (programming language) - Wikipedia, the free encyclopedia. Wikimedia Foundation, Inc.. URL: http://en.wikipedia.org/wiki/S_(programming_language). Last access: 31 Jul 2009.
Quick-R: Home Page. Robert I. Kabacoff, Ph.D.. URL: http://www.statmethods.net/index.html. Last access: 31 Jul 2009.