This section is going to analyze different data about the gedit project. You can find more information about the tools used at Appendix A, Tools. Furthermore, all the steps needed to generate the charts are explained at Appendix B, Instructions appendix.
In this section we are going to analyze the information extracted with SLOCCount over different versions of gedit. Summarizing, SLOCCount counts the source lines of code of a program.
The versions used were: 0.5, 0.9, 2.0 and all stable releases from this onwards, that is the versions ended with even numbers.
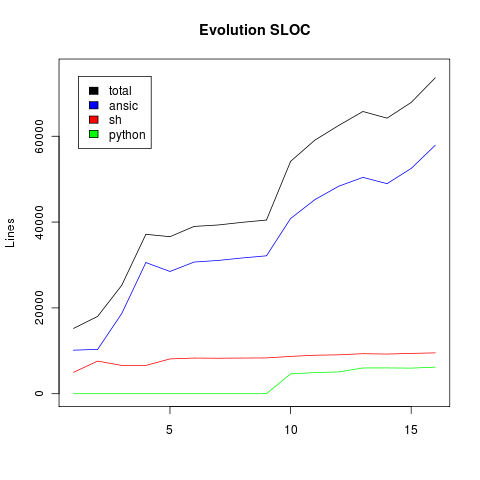
In the Figure 1, “Evolution source lines of code” you can see the evolution of source lines between the different versions. The chart reflects a continuous (more or less) growth since the beginning of the project.
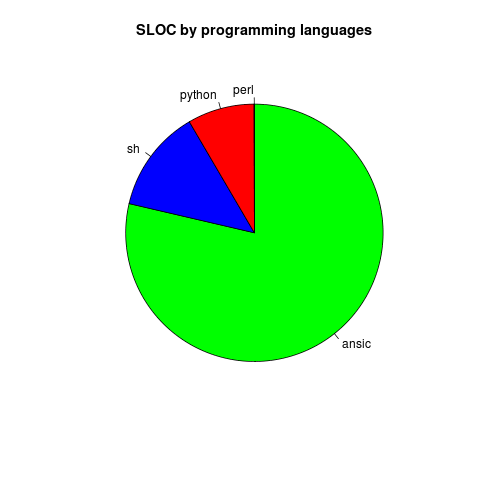
gedit is mainly written in C (78.64% in the last stable version 2.26) as it is clearly showed in the Figure 2, “Source lines of code by programming language ”. Again the main language are the same of the most GNOME projects. Another languages used are: Bash, mainly for configuration and compilation; and Python, in order to support plugins written in that language.
In this section it is shown an analysis based on the data extracted from the SVN repository of the gedit project. This data was extracted with CVSAnalY. As the repository used was the SVN, the last data is from April 2009; because of the GNOME migration to Git happened in that date.
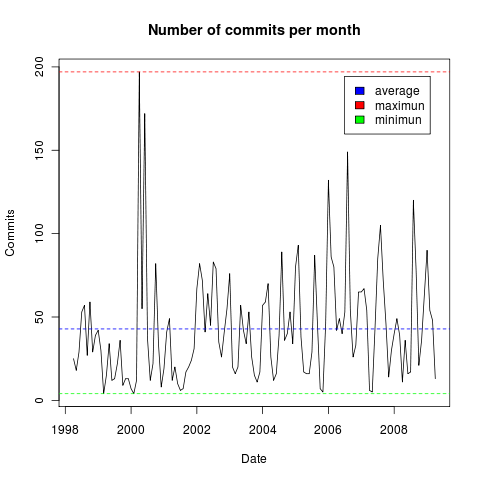
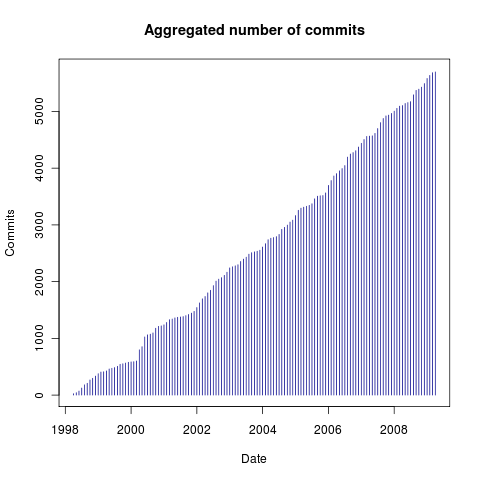
There have been 326 committers throughout the project history, that have made a total of 5697 commits. The number of commits per month activity has a lot of ups and downs with an average of 42.83 (see Figure 3, “Evolution of commits per month”). The maximum were 197 in April 2000, and the minimum is shared between March 1999 and February 2000 with just 4 commits. Anyway, in the logn term the activity is keeping almost constant as it is shown in Figure 4, “Aggregated number of commits up to time”.
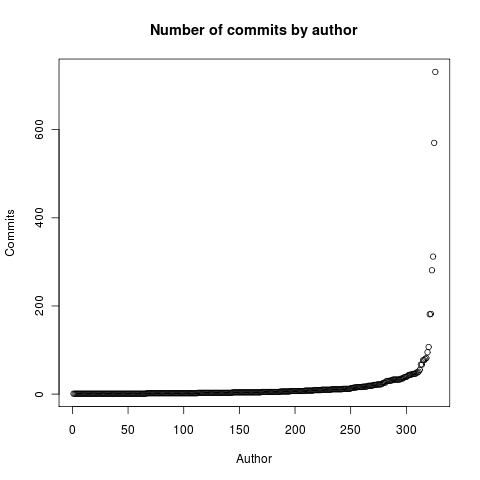
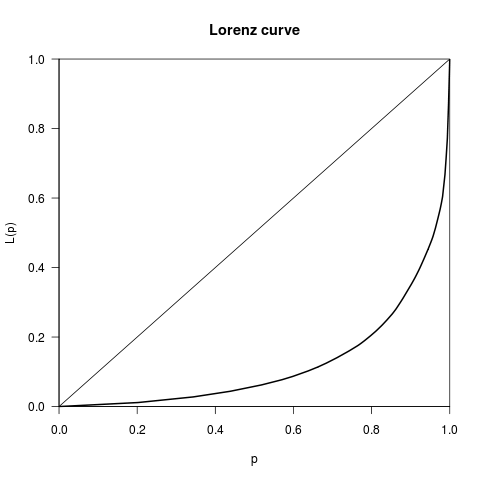
The Figure 5, “Number of commits per author” shows the number of commits per author. Then, in order to study the relation between the committers and the number of commits in depth, it was calculated the Gini coefficient, in this case the value is 0.7546308. As usual in free software projects this value confirms the Pareto principle, which states that, roughly 80% of the commits are done for 20% of the committers, and viceversa. The Lorenz curve (see Figure 6, “Lorenz curve”) shows this relation, where the perfect equity would be the straight line.
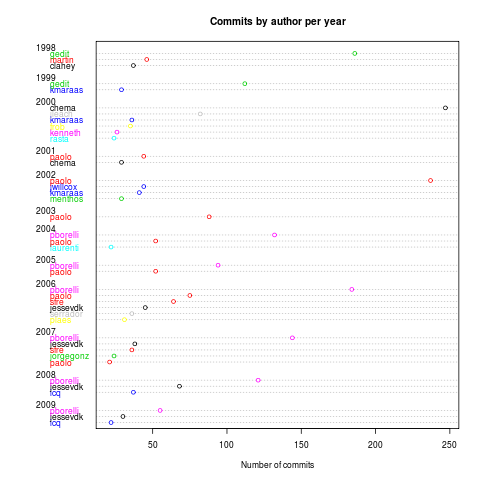
Finally, the next chart (Figure 7, “Number of commits by author per year”)
shows the number of commits made by the most collaborative authors per year.
That means, for every year it shows the commits for authors that made more than
20 commits. Thanks to this chart you can see how different developers appear and
disappear during the project history. Where the main contributors per year have
been: gedit (1998-1999), chema (2000),
paolo (2001-2003) and pborelli
(2004-2009).
The gedit project has been using a mailing list since April 2000. Mailing List Stats was used to analyze this mailing list.
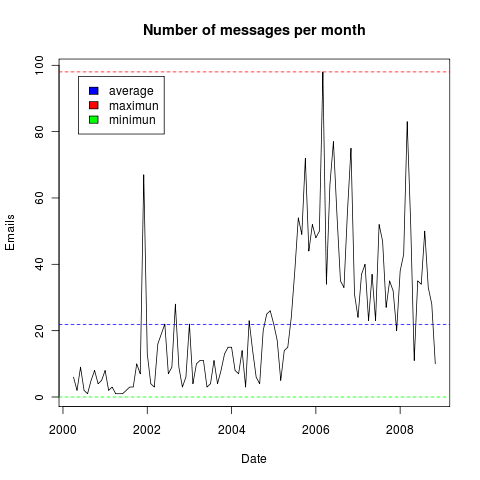
The total number of emails sent to this list is 2446, and these emails were written by 613 different email addresses. The mean of messages per month is 21.84 (see Figure 8, “Evolution of messages per month”).
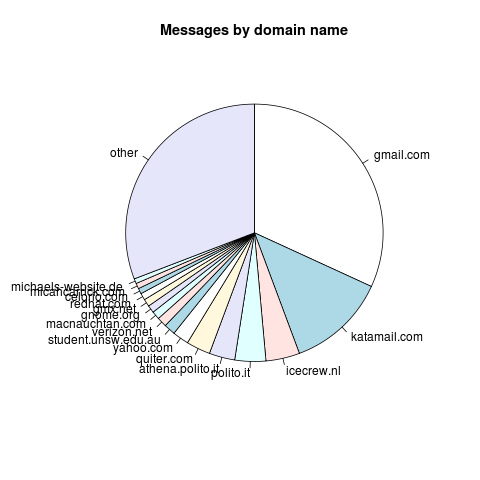
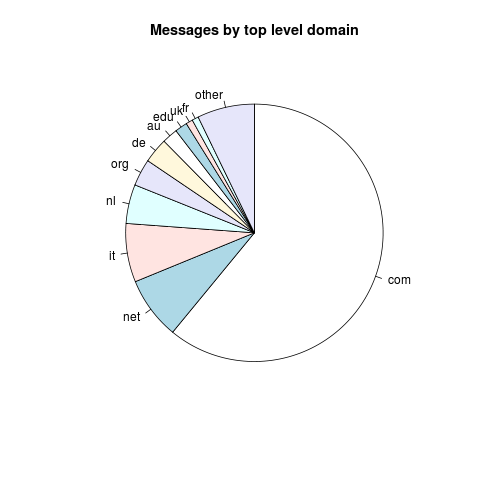
The most common domain name is gmail.com and the top level domain is com. However, the it domain is in the first position (taking into account just country domains), mainly because of two of the main contributors are Italians. The charts Figure 9, “Messages by domain name” and Figure 10, “Messages by top level domain” show the number of messages sent to the mailing list by domain.